


Every month, Afnic makes a set of data available to the public.
This data include:
- .fr domain names
- .fr indicators by owner country
- .fr indicators by month, quarter and year
- number of .fr domain names by zipcode
- .fr indicators by type of owner
- .fr indicators by owner zipcode
- .fr indicators by type of domain
- .fr indicators by registrar
So, for example, you can study the geographical distribution of domain name owners, the proportion of businesses that have a domain name, etc.
This data is available here.
Today, we’re going to look at how to study the creation of domain names associated with the term ‘COVID’ in .fr.
There are many different ways of doing this. We’re going to use Python processing with a new library called Vaex.
Python is a programming language widely used for data processing and very often used in conjunction with Pandas.
When decompressed, the ‘noms de domaine en point fr’ (.fr domain names) file is 0.45 GB! With files of this size, it is possible to use Pandas, but processing would take rather a long time.
Vaex is in fact a development of the Pandas API with technical choices allowing these kinds of volumes to be processed almost instantaneously.
The first step is to download the file. Nothing difficult about this since the data are in a .csv zipped file. Classic!
We import the libraries and the file:
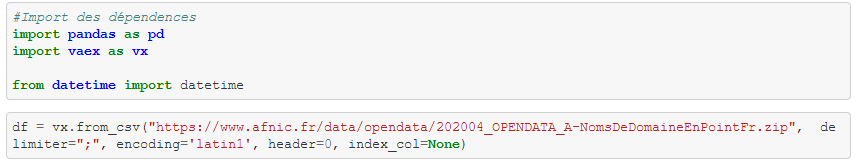
We notice that the file name includes the month and year. If you wish to automate the import and processing, all you need to do is generate the url. The file is in Latin-1, since the French requires accents.
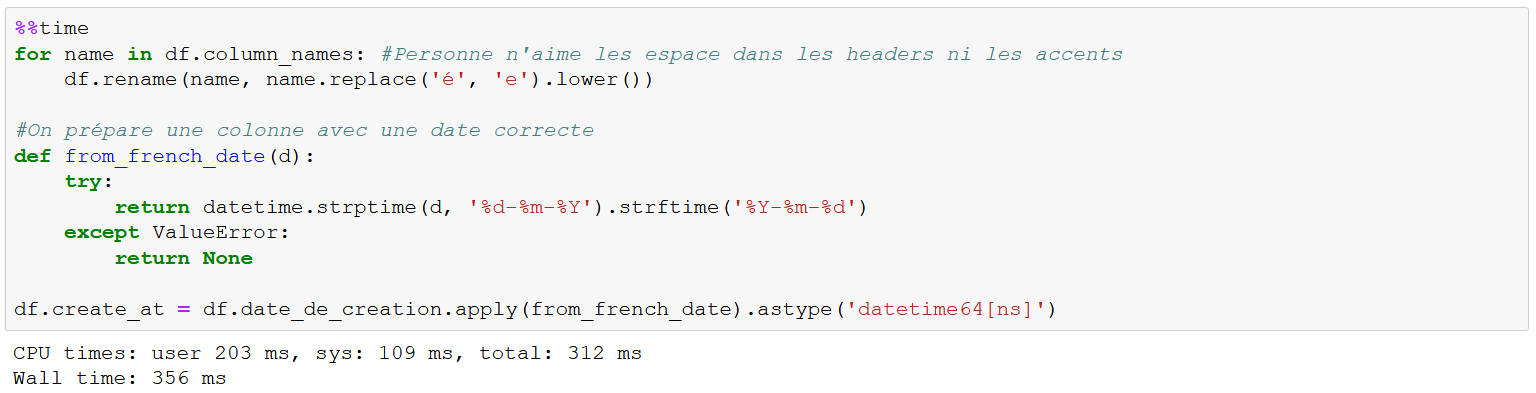
Next, it is necessary to perform a small processing operation to get rid of the spaces and accents in the column headings. We’re going to take this opportunity to also change the date format, which is French.
Now that we have the imported file in the Dataframe “df”, let’s see what we have. we see that we have more than 6M domains, some of them with “date deleted from Whois”. So we find ourselves with a file with the whole zone since its creation, or at least since the open data was made available, with the domains that are still active, those with no deletion date, and the rest, inactive.
![]()
We’re going to keep only those domains created since January 2020.
This greatly reduces the number, to just 208,732 domains. So now we prepare our analyses by filtering our data. Vaex is very useful in this case since it offers us a lazy computation system allowing us to very quickly tag a set of data and process them only when we need them.
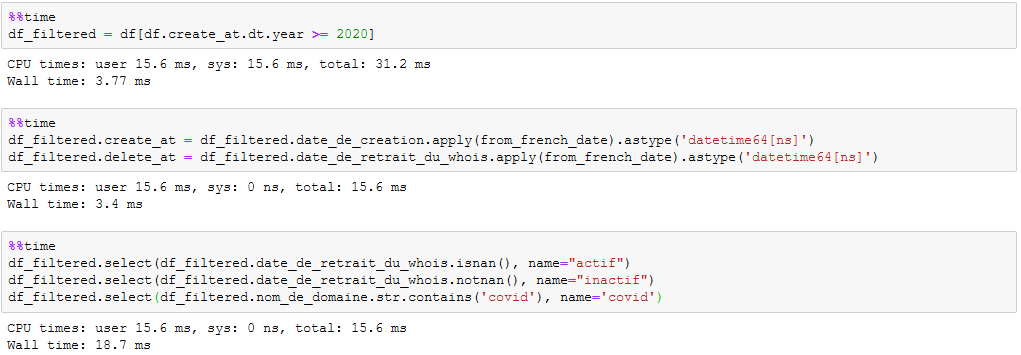
Now let’s look only at the domain names of interest to us.
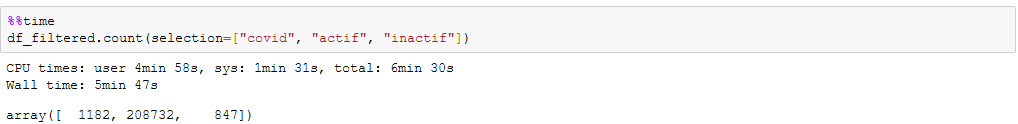
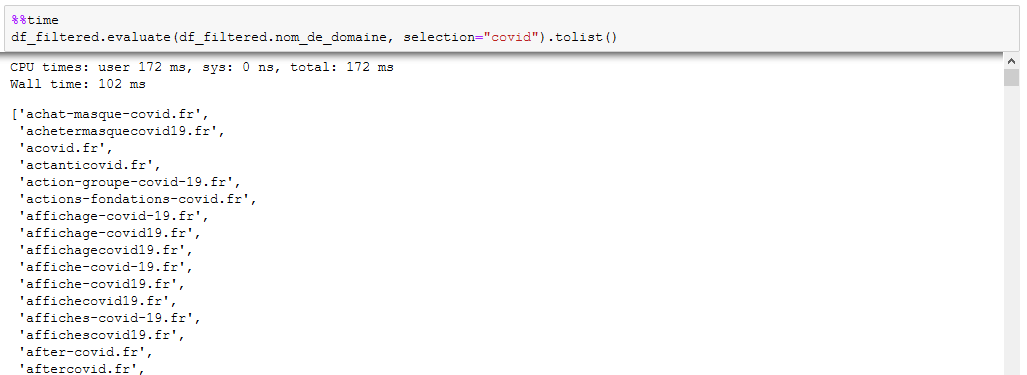
Around 1,200 domains – so not that many compared with the total number created.
Let’s take a quick look at the number of domains created during this period
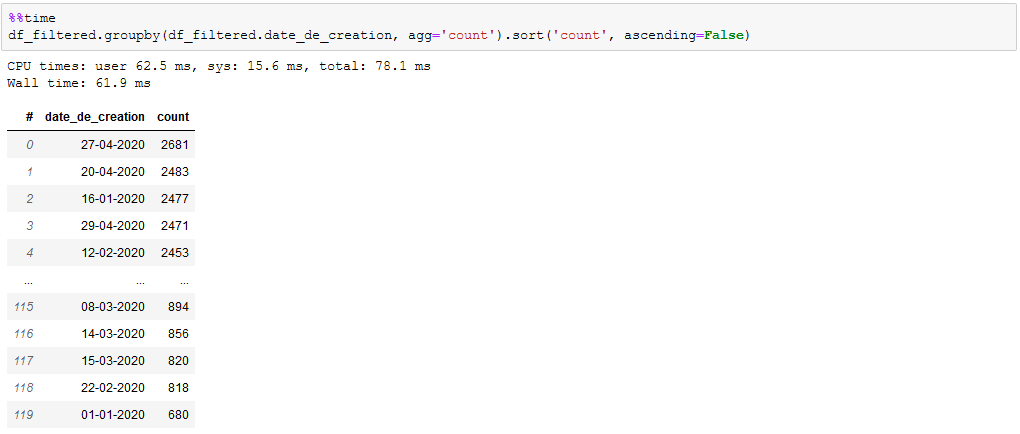
The top five are revealing; we see that April was the strongest month in terms of domain creation.
Finally, let’s take a look at the domains
With this short demonstration, we’ve seen how simple it is to use Afnic open data. You can carry out different analyses such as trends in domain creation, how long they stay registered for on average, etc.
The entire code is available from Afnic’s GitHub.
On the same topic
06/19/19
A brief example of using Afnic Open Data
Which domain names are derived from a first name?
12/15/15
OpenData: Data from the .fr TLD to serve innovation
Afnic, a leader of the Internet in France, is continuing its initiatives to promote the development...
Shared data: reuse .fr data
By publishing several million items of public data related ...
Featured

04/15/24
Afnic, the Registry for .fr Internet domain names , announced ...
Learn more
The pharmaceutical industry consists of several activities: ...
Learn more